
Happiness Equals Reality Minus Expectations
“Happiness equals reality minus expectations” is a saying that applies to life, financial planning, and investing. Travel and dining experiences are great life examples. When we have low expectations, it doesn’t take an amazing adventure or Michelin star meal to make us happy. If our expectations are high, the hurdle to happiness is higher. Financial markets are no different. By nature, markets anticipate future events and assign them a price today (discounting). The gap between reality and expectations creates short-term market volatility, just as it did for both stocks and bonds in 2022.
There are several notable areas where the expectations gap is showing up today: inflation, interest rates, and the labor market.
First, CPI data shows inflation moderating from a peak of over 9% last year to 5% more recently. CPI measures inflation we’ve already experienced. Consumer surveys and market pricing reflect expectations of future inflation rates, and they continue to moderate as well, projecting inflation below 3%. Despite the data, a narrative remains that we have entered a new regime where inflation will remain persistently high, above 4%.
OPEC+, a group of oil producing countries and Russia, recently surprised the market when it announced cuts to oil production starting in May. This announcement compounded previous cuts and led to a short-term increase in oil prices, affecting the entire global economy. One of the primary drivers of inflation last year was Russia's invasion of Ukraine, which drove oil prices above $120 per barrel, increasing gas prices and other consumer and business goods.
Many expect this will lead to a hyper-inflation scenario like the 1970s/1980s – you may have seen memorable pictures of long lines at the pump as consumers hoarded gas before the price rose higher. It's important to maintain perspective, though: The reality is the relevance of OPEC as a price-setting cartel has declined over the past decades, partly because cuts by each country are voluntary and difficult to enforce, and because the US has become the top producer of oil in the world. Also, in Europe, warmer weather and government policies discouraging excessive energy use have helped reduce sensitivity to energy prices. Despite the price increases in widely followed global and US oil benchmarks (Brent and West Texas Intermediate (WTI), respectively), they remain well below their recent peaks (see chart 1, below). So far, there is little reason to believe that oil prices at these levels will result in hyperinflation.
Global Oil Prices - West Texas Intermediate (WTI) and Brent Crude oil prices over the past 20 years

Source: Clearnomics, Refinitiv, Time Period: April 11, 2002 - April 11, 2023
Second, there is another expectations gap between the Fed’s interest rate signals vs the market’s interest rate expectations. In other words, the market isn’t necessarily buying what the Fed is selling.
This divergence was exacerbated by the March banking crisis (see chart 2, below).
Number of Bank Failures and Total Deposits of Failed Banks Since 2001

Source: Clearnomics, FDIC, Time Period: January 2001 to March 2023
Bank failures highlight an unintended consequence of rapid rate hikes. Risks to financial stability create a new sense of caution for the Fed as it continues to battle inflation.
While the Fed projects another interest rate increase and has stated it will likely hold rates above 5% for the remainder of the year, investors aren’t so sure, pricing in rate cuts by September.
Once again, we have a disparity between the two sides, which could cause market swings in the coming months as events unfold. It's important to maintain a long perspective and not react to short-term movements.
Finally, the unexpected resilience of the labor market is also impacting markets. Strength in job creation continues to be counterintuitive to the expected slowdown from interest rate increases. While the rate of job market growth is slowing, the pace is higher and more sustained than a significant tightening of financial conditions or a possible recession would suggest.
While the tech industry has seen layoffs, job openings have fallen and labor participation has increased, so the 3.5% unemployment rate remains well below expectations at this point in the economic cycle (see chart 3, below).
U-3 Unemployment and U-6 Under-Employment Rates, Since 19601
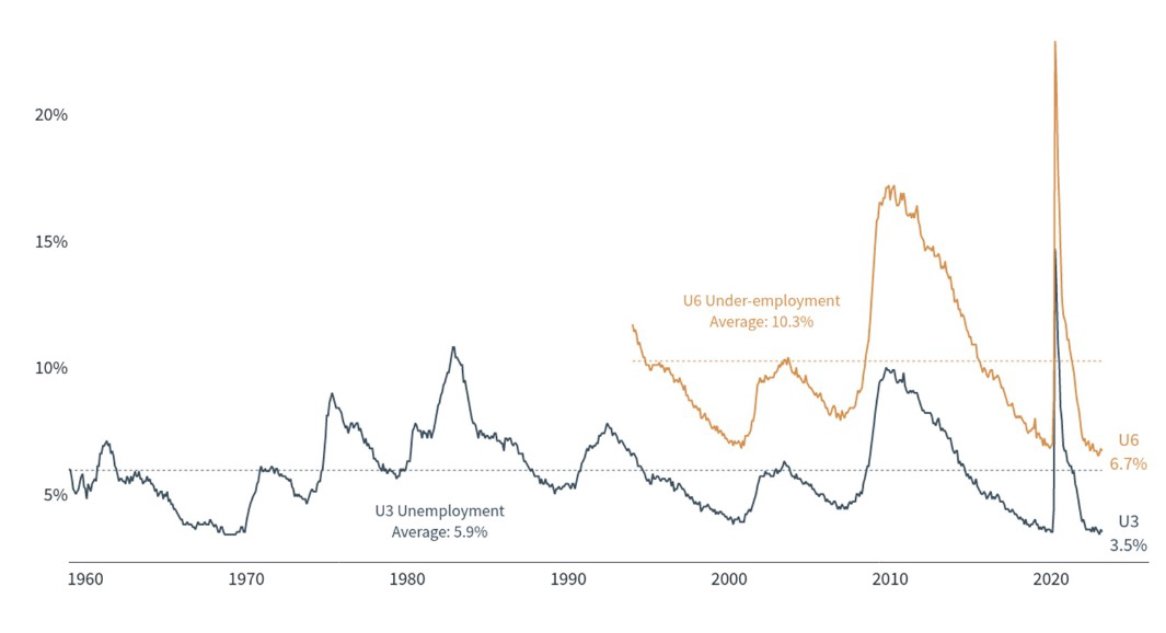
Source: Clearnomics, Bureau of Labor Statistics, Time Period: January 1960 to March 2023
We hope this helps bring to light some recent examples of where reality and expectations are at odds, and how the mismatch could impact markets’ “happiness”. Understanding that missed expectations drive volatility can help you stay the course with your investment plan. Bouts of short-term volatility are typically noise for long-term investors, and we believe our portfolios remain well-positioned for long-term success.
——
Past performance is not a guarantee of future results. Indices are not available for direct investment. Index performance does not reflect the expenses associated with the management of an actual portfolio. Index returns reflect all items of income, gain and loss and the reinvestment of dividends and other income. For WWP Important Disclosures and Index Descriptions: www.waywpointwp.com/index-descriptions
——