
ECONOMY
High inflation, rising interest rates, and geopolitical risks continued to weigh on the outlook for global economic growth. Central bankers and market participants are trying to assess how much financial conditions will have to be tightened to reign in inflation and whether that will lead to a mild slowdown in growth that we’ve already begun to see or push us into a recession. These times of economic resetting are a natural, though unpleasant, part of the economic cycle. By reigning in excesses, we set ourselves up for a more sustainable future growth path. A very tight labor market with two jobs available for every unemployed worker, ample consumer savings, and capital expenditures by businesses are helping the economy from losing too much steam too fast.
The near-term uncertainty led to steep losses for the quarter in global capital markets. We continued to harvest losses for tax-saving purposes where it made sense throughout the quarter. All asset classes except cash lost value and with high inflation, cash has asymmetric downside given the loss of purchasing power and inability to earn future excess returns to make up for it. This is one of those crucial times where the ability to stay invested can allow us to capture the longer rebounds that tend to follow these swift declines.
STOCKS
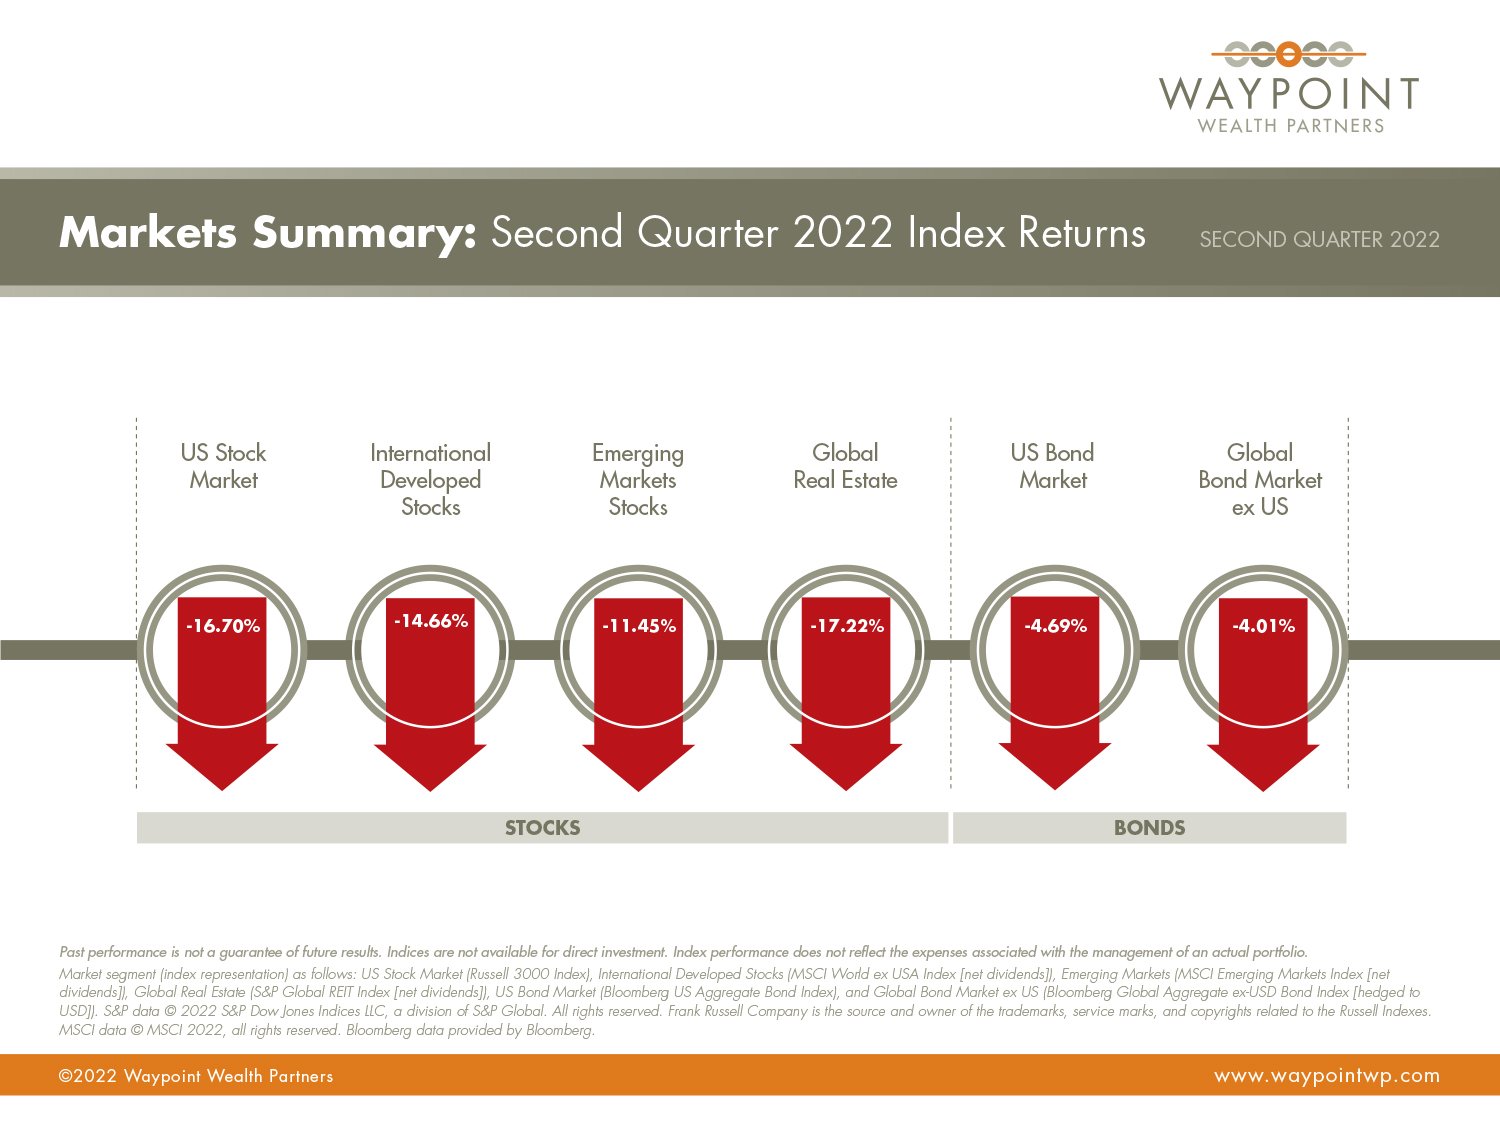
Global stocks, measured by the MSCI All-Country World Index (ACWI), were down about -15.6% during Q2. China was the only country in the ACWI to earn positive returns for the quarter. Value stocks outperformed growth across global markets, and larger companies generally outperformed smaller. Our long-term tilt toward companies with low relative prices helped performance vs. our benchmarks for the quarter and year-to-date. Still, we remain broadly diversified in our overall equity positioning in keeping with our investment philosophy. Valuations have compressed and are much more attractive. Earnings growth is slowing though profit margins remain near historic highs.
U.S. stocks (Russell 3000) were down about -16.7% in Q2. Our systematic U.S. stock strategies outperformed by about 1.5% for the quarter, helping relative performance.
International developed stocks (MSCI World ex-US IMI) outperformed U.S. stocks, losing -15.2% for the quarter. Our systematic international stock strategies outperformed by about 1.2%, helping performance relative to the benchmark.
Emerging markets stocks (MSCI EM IMI) posted the best regional results, beating U.S. and Developed International stocks, down about -12.1% for the quarter. Our systematic emerging markets stock strategies outperformed the benchmark for the quarter by about 0.4%, a benefit for our relative performance.
As markets continuously take new information into consideration, price swings happen quickly and are unpredictable, which is why we take a diversified approach in seeking to capture returns and manage risk. The current risk environment can lead to more volatile but higher returns over time in stock markets. Foreign valuations are quite attractive for long-term investors, but position sizing is crucial to risk management so any adverse outcomes don’t derail our overall portfolio planning.
BONDS
Interest rates increased across all maturities in the U.S. Treasury market for the quarter, more so in the front end, resulting in a very flat yield curve. The 1-Month US Treasury Bill yield increased 111 basis points (bps) to 1.28%. The yield on the 2-Year US Treasury Note increased 64 (bps) to 2.92%. The yield on the 5-Year US Treasury Note increased 59 bps to 3.01%. The yield on the 10-Year US Treasury Note increased 66 bps to 2.98%. The yield on the 30-Year US Treasury Bond increased 70 bps to 3.14%.
Due to the rise in interest rates, all bond sectors and maturity ranges had another challenging quarter. The broad taxable investment grade bond index (U.S. Agg) was down -4.69% for the quarter. Global bonds ex-US were also down -4.0% for the quarter. Our active intermediate-term bond managers outperformed their benchmark by about 0.2%, while our systematic short-term bond strategies underperformed their respective benchmarks by about 0.4% in aggregate. Overall, our shorter duration and higher quality fixed income allocation has added value relative to the broad bond market for the quarter and year-to-date. Municipals fared a bit better with the broad index down -2.94%. TIPS were among the worst-performing fixed-income sectors for the three-month period which is counter to what many might expect in a high-inflation environment.
Bond yields are now higher than their averages since 2009, which is a positive sign for future expected returns. In the event of a more severe economic pullback, these higher yields, coupled with stable cash flows and what would likely be a decline in interest rates in that environment will help offset any further equity losses in our portfolios. Fixed income remains an important portfolio diversifier and risk management position.
REAL ESTATE
Global real estate (S&P Global REIT) was also down -17.22% for the quarter, underperforming both broad stock and bond markets. There are many factors that impact various segments of the broad global real estate market, interest rates being one. Our systematic strategy outperformed the broad index for the quarter by about 1.8%. Real estate equity is a return enhancer to our portfolios, providing additional diversification and correlation benefits to more traditional stock and bond holdings.
——
The information contained herein has been derived from sources believed to be reliable but is not guaranteed as to accuracy or completeness. All portfolio values and performance results reflect the reinvestment of dividends and other earnings and the deduction of investment advisory fees, commissions, and other expenses charged to your account. Certain values may not match the account values on your custodian’s statement as some custodians generate their statements before all month-end dividends have been posted to the account or do not reflect accrued interest for securities. Past performance is not indicative of future results. The return and value of your account will fluctuate and may be worth more or less than the amount shown in this report. Nothing herein should be construed as tax or legal advice, and you are urged to consult with your tax advisor when filing your taxes and attorney on legal matters. Indices are not available for direct investment. Index performance does not reflect the expenses associated with the management of an actual portfolio. Please remember to contact Waypoint Wealth Partners, Inc. if there are any changes in your financial situation or investment objectives, or if you wish to impose, add to, or modify any conditions regarding our investment management services. Note, however, that any requests to change the conditions of our investment management services must first be acknowledged and agreed to by us in writing. We urge you to compare the reports you receive directly from us with the monthly account statements you receive from your custodian. Please contact us if you have any questions.
——


Quarterly Article: Three Crucial Lessons for Weathering the Stock Market’s Storm (Excerpted by WWP for Brevity)
Investors can always expect uncertainty. While volatile periods like the one we’re experiencing now can be intense, investors who learn to embrace uncertainty may often triumph in the long run. Reacting to down markets is
a good way to derail progress made toward reaching your financial goals.
Here are three lessons to keep in mind during periods of volatility that can help you stick to your well-built plan. And if you don’t have a plan, there’s a suggestion for that too.
1. A RECESSION IS NOT A REASON TO SELL
Are we headed into a recession? A century of economic cycles teaches us we may well be in one before economists make that call.
But one of the best predictors of the economy is the stock market itself. Markets tend to fall in advance of recessions and start climbing earlier than the economy does.
Whether accompanied by recessions or not, market downturns can be unsettling. But over the past century, US stocks have averaged positive returns over one-year, three-year, and five-year periods following a steep decline.
A year after the S&P 500 crossed into bear market territory (a 20% fall from the market’s previous peak), it rebounded by about 20% on average. And after five years, the S&P 500 averaged returns over 70%.1
We believe that staying invested puts you in the best position to capture the recovery. If you take risk out of your portfolio, it should be a strategic, not tactical, choice. We believe the only good reason to sell out of a stock portfolio now—so long as it’s diversified and low-cost—is because you learned something about your risk tolerance or your investment goals have changed.

Past performance is no guarantee of future results.
Market declines or downturns are defined as periods in which the cumulative return from a peak is-10%, -20%, or -30% or lower. Returns are calculated for the 1-, 3-, and 5-year look-ahead periods beginning the day after the respective downturn thresholds of -10%, -20%, or -30% are exceeded. The bar chart shows the average returns for the 1-, 3-, and 5-year periods following the 10%, 20%, and 30% thresholds. For the 10% threshold, there are
29 observations for 1-year look-ahead, 28 observations for 3-year look-ahead, and 27 observations for 5-year look-ahead. For the 20% threshold, there are 15 observations for 1-year look-ahead, 14 observations for 3-year look-ahead, and 13 observations for 5-year look-ahead. For the 30% threshold, there are 7 observations for 1-year look-ahead, 6 observations for 3-year look-ahead, and 6 observations for 5-year look-ahead. Peak is a new all-time high prior to a downturn. Data provided by Fama/French and available at mba.tuck.dartmouth.edu/pages/faculty/ken.french/data_library.html. Fama/French Total US Market Research Index: 1926–present: Fama/French Total US Market Research Factor and One-Month US Treasury Bills. Source: Ken French website.
——
2. TIME THE MARKET AT YOUR PERIL
When stocks have declined, it might be tempting to sell to stem further losses. You might think, “I’ll sit out until things get a bit better.” But by the time markets are less volatile, you’ll have often missed part of the recovery. Yes, it stings to watch your portfolio shrink, but imagine how you’ll feel when it’s stuck while the market rebounds.
Big return days are hard to predict, and you really don’t want to miss them. If you invested $1,000 in the S&P 500 continuously from the beginning of 1990 through the end of 2020, you would have $20,451. If you missed the single best day, you’d only have $18,329—and only $12,917 if you missed the best five days.2
History shows the stock market tends to rebound quickly. The same can’t be said for individual stocks or even entire sectors. (How many railroad stocks do you own?) So, while investing means taking on some risk for expected reward, investors should mitigate risks where they can. Diversification is a top risk mitigation tool, along with investing in fixed income and having
a financial plan.
3. IT MAY BE A GOOD TIME TO REASSESS YOUR PORTFOLIO AND YOUR PLAN
We saw many fads crop up through the pandemic, from baking to puppy adoption. Did you experiment with one of the pandemic investment fads—FAANGs or meme stocks or dogecoin? If so, it may be time to put those fads in the rearview.
Do you know the names of all the stocks you own? Then you probably own too few. How much of your portfolio sits outside the US? Because about half the global market is comprised of foreign stocks. If you only invest in the S&P 500, you’re missing half of the investment opportunity set. A market-cap-weighted global portfolio is a better starting point than chasing segments of the market that have outperformed in the past few years.
And if you want to outperform the market, allow decades of academic research to light the way. Portfolios focused on small caps, value stocks, and more profitable companies have had higher returns over the long run. The portfolio I use is invested across more than 10,000 global equities in over 40 countries.
Beyond a well-designed portfolio, one of the best ways to deal with volatile markets and disappointing returns is to have planned for them. A financial advisor can help you develop a plan that bakes in the chances you’ll experience some market lows. And they can help you find the confidence to weather the current storm and get to the other side.
A sound approach to investing—through a plan, a well-designed portfolio, and an advisor—is the ultimate self-care during these rough markets. Your future self will thank you.
This article, written by Marlena Lee, PhD, first appeared in MarketWatch with the title “Follow These 3 Crucial Lessons for Weathering the Stock Market’s Storm.”
——
1. S&P data © 2022 S&P Dow Jones Indices LLC, a division of S&P Global. All rights reserved. Indices are not available for direct investment.
2. Past performance, including hypothetical performance, is no guarantee of future results. Growth of $1,000 is hypothetical and assumes reinvestment of income and no transaction costs or taxes. The analysis is for illustrative purposes only and is not indicative of any investment. S&P data © 2022 S&P Dow Jones Indices LLC, a division of S&P Global. All rights reserved. Indices are not available for direct investment.
Diversification neither assures a profit nor guarantees against loss in a declining market. Past performance is not a guarantee of future results.
The information in this material is intended for the recipient’s background information and use only. It is provided in good faith and without any warranty or representation as to accuracy or completeness. Information and opinions presented in this material have been obtained or derived from sources believed by Dimensional to be reliable and Dimensional has reasonable grounds to believe that all factual information herein is true as at the date of this material. It does not constitute investment advice, recommendation, or an offer of any services or products for sale and is not intended to provide a sufficient basis on which to make an investment decision. Before acting on any information in this document, you should consider whether it is suitable for your particular circumstances and, if appropriate, seek professional advice. It is the responsibility of any persons wishing to make a purchase to inform themselves of and observe all applicable laws and regulations. Unauthorized reproduction or transmitting of this material is strictly prohibited. Dimensional accepts no responsibility for loss arising from the use of the information contained herein. This material is not directed at any person in any jurisdiction where the availability of this material is prohibited or would subject Dimensional or its products or services to any registration, licensing or other such legal requirements within the jurisdiction.
Investments involve risks. The investment return and principal value of an investment may fluctuate so that an investor’s shares, when redeemed, may be worth more or less than their original value. Past performance is not a guarantee of future results. There is no guarantee strategies will be successful.
Dimensional Fund Advisors LP is an investment advisor registered with
the Securities and Exchange Commission. Investment products:
• Not FDIC Insured • Not Bank Guaranteed • May Lose Value
Dimensional Fund Advisors does not have any bank affiliates.
——