
Markets Update: A Quarter in Review
To date 2019 has been a year of superlatives. The strongest January market returns since 1987, the lowest weekly U.S. jobless claims since 1969 and the longest U.S. economic expansion on record. On the flip side, we have the weakest eurozone manufacturing data since 2010, the flattest U.S. yield curve since the global financial crisis and tariffs at their highest level in half a century. The actual tariff levels remain relatively small, but the trade dispute is having a tangible impact on markets and the global economic outlook.
BONDS
Fixed income had a good quarter. U.S. bonds returned 3.08% and global bonds earned 2.75%. The Federal Reserve has been clear that they do not plan on increasing interest rates in the short term and is considering lowering rates in the intermediate term. The trade dispute is the most prominent rationale discussed in the press but the continued below expectation inflation data is just as valid a reason for the dovish tone. Markets are now pricing in rate cuts for the second half of the year which is remarkable given that just 6 months ago the market was pricing in 2-3 rate increases.
STOCKS
Stocks around the globe had another strong quarter continuing the trend set in Q1. U.S. stocks led the way returning 4.1%, with international stocks a close second returning 3.79% and emerging markets eking out a return of .61%. The resilience in the stock market has emboldened the Trump administrations rhetoric on trade and immigration but it is a drag on corporate confidence and earnings. It is likely that trade rhetoric would soften if stocks fell sharply and in that in that case we would not be surprised to see some type of deal being announced. Any such trade deal is probably not going to be comprehensive and even less likely to address some of the core differences between Beijing and Washington. Any deal would be better than the current uncertainty. All together we see more volatility in the second half of the year with the most likely outcome being low single digit returns to either the upside or downside. That said we remind ourselves to expect the unexpected and don’t rely on short term forecasts to drive your investment strategy.
Economy
The global economic growth has slowed but remained positive in the second quarter. The labor market remains robust with the unemployment rate dropping to 3.6% and wage growth continuing its slow but upward trend at 3.4%. Despite the strong labor statistics, inflation remains stubbornly low at 1.8%. Based on the economic indicators we follow, the probability of a U.S. recession in the next 12 months has increased slightly but remains low. Globally, we are seeing an increasing weakness in manufacturing around the world with the lowest levels being in the Eurozone and indications that global recessions risks have increased. Tariffs have a larger impact on international markets and the pendulum is swinging between hopes of growth rebounding and rates falling and fears of increasing trade tensions. As this unfolds, we are prepared for both attractive buying opportunities caused by market pullbacks and potential for solid returns as the current administration is highly motivated to avoid a recession in the near term.
—


—
Topic of the Quarter: The Uncommon Average
“I have found that the importance of having an investment philosophy—one that is robust and that you can stick with— cannot be overstated.”
—David Booth
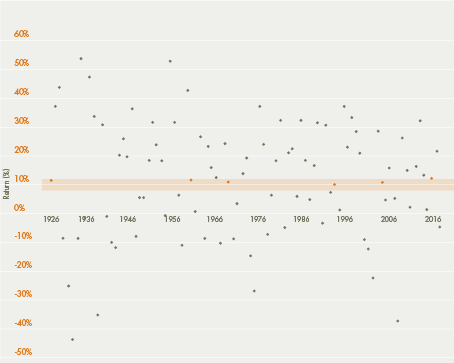
The US stock market has delivered an average annual return of around 10% since 1926. But short-term results may vary, and in any given period stock returns can be positive, negative, or flat. When setting expectations, it’s helpful to see the range of outcomes experienced by investors historically. For example, how often have the stock market’s annual returns actually aligned with its long-term average?
Exhibit 1 shows calendar year returns for the S&P 500 Index since 1926. The shaded band marks the historical average of 10%, plus or minus 2 percentage points. The S&P 500 Index had a return within this range in only six of the past 93 calendar years. In most years, the index’s return was outside of the range—often above or below by a wide margin—with no obvious pattern. For investors, the data highlight the importance of looking beyond average returns and being aware of the range of potential outcomes.
In US dollars. S&P data © S&P Dow Jones Indices LLC, a division of S&P Global. Indices are not available for direct investment. Index returns are not representative of actual portfolios and do not reflect costs and fees associated with an actual investment. Past performance is no guarantee of future results. Actual returns may be lower.
EXHIBIT 1. S&P 500 INDEX ANNUAL RETURNS 1926–2018
TUNING IN TO DIFFERENT FREQUENCIES
Despite the year-to-year volatility, investors can potentially increase their chances of having a positive outcome by maintaining a long-term focus. Exhibit 2 documents the historical frequency of positive returns over rolling periods of one, five, and 10 years in the US market. The data show that, while positive performance is never assured, investors’ odds improve over longer time horizons.
EXHIBIT 2. FREQUENCY OF POSITIVE RETURNS IN THE S&P 500 INDEX
OVERLAPPING PERIODS: 1926–2018

CONCLUSION
While some investors might find it easy to stay the course in years with above average returns, periods of disappointing results may test an investor’s faith in equity markets. Being aware of the range of potential outcomes can help investors remain disciplined, which in the long term can increase the odds of a successful investment experience. What can help investors endure the ups and downs? While there is no silver bullet, understanding how markets work and trusting market prices are good starting points. An asset allocation that aligns with personal risk tolerances and investment goals is also valuable. By thoughtfully considering these and other issues, investors may be better prepared to stay focused on their long-term goals during different market environments.
In US dollars. From January 1926–December 2018, there are 997 overlapping 10-year periods, 1,057 overlapping 5-year periods, and 1,105 overlapping 1-year periods. The first period starts in January 1926, the second period starts in February 1926, the third in March 1926, and so on. S&P data © S&P Dow Jones Indices LLC, a division of S&P Global. Indices are not available for direct investment. Index returns are not representative of actual portfolios and do not reflect costs and fees associated with an actual investment. Past performance is no guarantee of future results. Actual returns may be lower.
Past performance is no guarantee of future results. There is no guarantee an investing strategy will be successful. Diversification does not eliminate the risk of market loss.
All expressions of opinion are subject to change. This article is distributed for informational purposes, and it is not to be construed as an offer, solicitation, recommendation, or endorsement of any particular security, products, or services. Dimensional Fund Advisors LP is an investment advisor registered with the Securities and Exchange Commission. ©2018 Dimensional Fund Advisors LP. All rights reserved. Unauthorized copying, reproducing, duplicating, or transmitting of this material is prohibited.