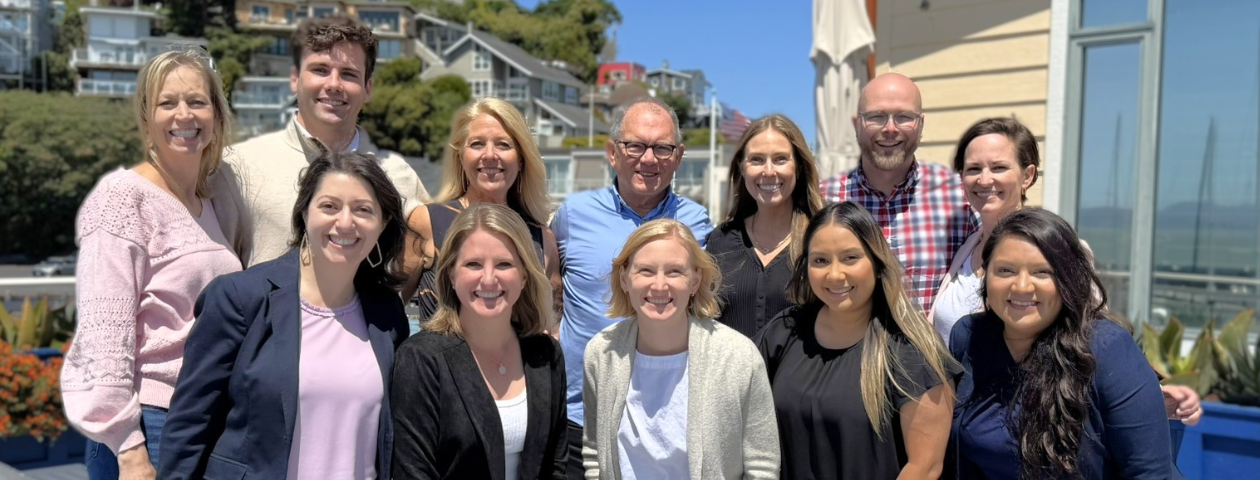
Meet Our Advisory Team
Connect with one of our trusted Financial Advisors in the Northern Bay Area. We are here to be a partner with you on your financial journey and help you make well-informed, important life decisions related to your wealth. Please contact our Mill Valley, CA advisory team if we can be of service.
Connect with Us
Managing Directors
Courtney Hutchinson, CFP®
Partner, Managing Director
Courtney is a Partner and Managing Director for the Beacon Pointe Mill Valley, CA office, bringing over two decades of experience in the financial services industry. Prior to joining Beacon Pointe through the 2025 acquisition with Waypoint Wealth Partners, Courtney spent more than 10 years advising clients at Barclays Wealth, Bernstein Global Wealth Management, and Ashfield Capital Partners and served as the Chief Operating Officer at Waypoint. She began her career in client service and advisory roles, with a strong focus on holistic financial planning for high-net-worth individuals and families. Courtney earned her Bachelor of Arts in Economics with a minor in French Literature from the University of California, San Diego. She holds a graduate certificate from the UC Berkeley Personal Financial Planning Program and is a graduate of both the Schwab Executive Leadership Program and the G2 Leadership Institute. She is also a CERTIFIED FINANCIAL PLANNER® (CFP®) professional and an active member of the Beacon Pointe Women’s Advisory Institute. Outside of the office, Courtney enjoys spending time outdoors with her family and friends in the beautiful Bay Area. She and her husband stay busy with their two daughters, who love exploring hiking trails and beaches.

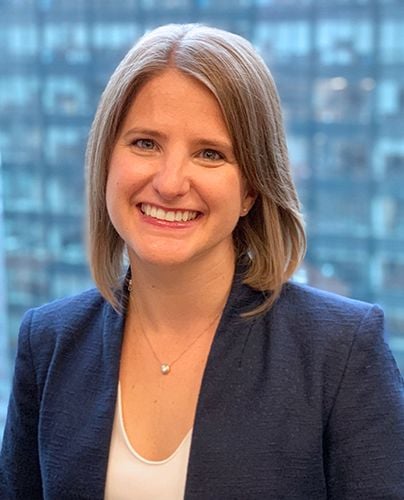
Jesse Shore, CFP®
Partner, Managing Director
Jesse is a Partner and Managing Director for the Beacon Pointe Mill Valley, CA office. With nearly a decade of financial planning experience, her client-centered approach helps individuals and families achieve their financial goals. She began her career in corporate finance at Gilead Sciences before transitioning into wealth management in 2016. Jesse joined Waypoint Wealth Partners, which was subsequently acquired by Beacon Pointe Advisors in 2025, and became a partner in 2023.
She holds a B.A. in Economics (minor in Corporate Finance) from Claremont McKenna College and is a CERTIFIED FINANCIAL PLANNER® (CFP®) professional. Jesse is also an active member of the Beacon Pointe Women’s Advisory Institute.
Outside of the office, Jesse and her husband, Matthias, divide their year between New Orleans (fall through spring) and Portland, Oregon (summer). In June 2024, they welcomed their first child, Matilda. The family is planning to move back to the Bay Area to be closer to family and friends. When they’re not working or traveling, you can usually find them at local parks, socializing with neighbors, or splashing in the pool.
Wealth Advisors

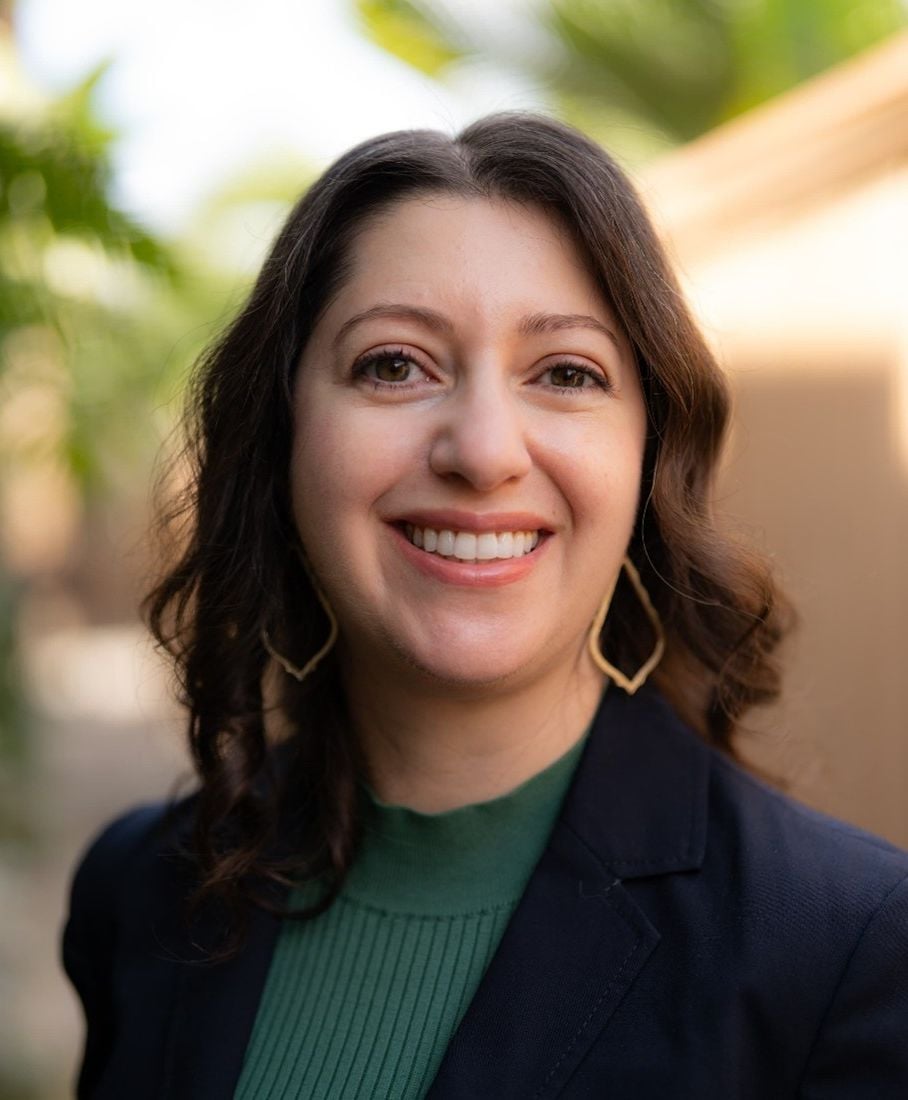
Anabel Diaz, CFP®
Senior Associate Wealth Advisor
Anabel is a Senior Associate Wealth Advisor for the Beacon Pointe Mill Valley, CA office, focused on supporting clients in the areas of financial planning and tax planning. Prior to joining Beacon Pointe through the acquisition of Waypoint Wealth Partners in 2025, Anabel served as a financial planner and tax preparer at Natural Bridges Financial Advisors, an independent Registered Investment Advisory (RIA) firm. Anabel is both a CERTIFIED FINANCIAL PLANNER® (CFP®) professional and an IRS Enrolled Agent, committed to helping individuals and families navigate their financial journeys with clarity and confidence. Anabel earned her B.A. in Economics from the University of California, Santa Cruz, and her M.S. in Financial Planning from Golden Gate University, where she also completed the university’s Financial Life Planning Program. She is an active member of the Financial Planning Association (FPA), the National Association of Personal Financial Advisors (NAPFA), and Beacon Pointe’s Women’s Advisory Institute. Outside of the office, Anabel enjoys spending time outdoors with her partner, Alfonso, and their dog, Arlo, especially at the beach or the local dog park. She’s also passionate about horseback riding, taking weekly English riding lessons, and gives back to the community through active volunteer work with organizations like the SPCA and Make-A-Wish Foundation.

Annette Brinton, CFP®
Partner, Senior Wealth Advisor
Annette Brinton is a Partner and Senior Wealth Advisor for the Beacon Pointe Mill Valley, CA office, bringing over three decades of experience as a finance professional to the clients she serves. She is passionate about helping people gain clarity over their financial situation and managing their wealth to provide for a fulfilling life.
Prior to co-founding Waypoint Wealth Partners, which joined Beacon Bointe Advisors in 2025, Annette had her own firm and worked as a Client Advisor for two independent wealth management firms in the Bay Area. Annette started her career in the early 90’s with Ernst & Young, doing both audit and individual tax work, and subsequently spent over 10 years working in corporate finance and operations. She has worked extensively in over 20 countries around the world including a year in Hong Kong and China and three years living in London.
Annette holds a B.A. in Business Economics from the University of California, Santa Barbara, and a graduate certificate in Personal Financial Planning from UC Berkeley. She is also a CERTIFIED FINANCIAL PLANNER® (CFP®), an active member of the Financial Planning Association, and a leader within Beacon Pointe’s Women’s Advisory Institute. Outside of the office, Annette is deeply involved in the Sausalito community. She serves on the Board of Literacy by the Bay and is a long-standing member of the Sausalito Women’s Club, where she chairs the Fiscal Advisory Board and sits on the Scholarship Board. In her free time, she enjoys hiking, snowboarding, traveling with her husband Adrian, and sharing good food with friends.

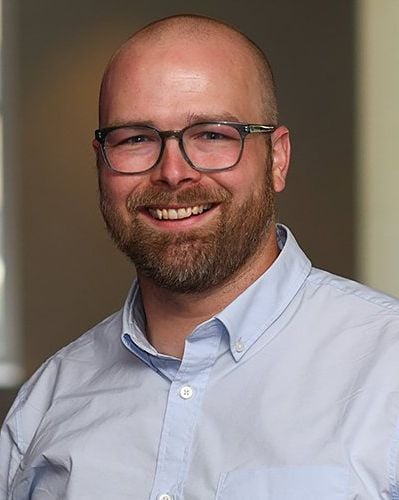
Chuck Bowes, CFP®
Partner, Senior Wealth Advisor
Chuck is a Partner and Senior Wealth Advisor for the Beacon Pointe Mill Valley, CA office, bringing over 25 years of professional experience and a data-informed, client-centered approach to wealth management. Chuck began his career in the 1980s in the emerging “big data” industry, holding leadership positions at companies such as Teradata, AT&T, and Broadbase Software. In these roles, he collaborated with senior executives across finance, marketing, and information technology to transform large-scale data into strategic insights. His passion for combining analytical rigor with human-centered decision-making ultimately led him to transition into the wealth advisory space. He earned his B.A. in Business Administration, graduating manga cum laude from San Diego State University, and later received a graduate certificate with distinction from the UC Berkeley Personal Financial Planning Program. Chuck is also a CERTIFIED FINANCIAL PLANNER® (CFP®) professional. Outside of the office, Chuck enjoys a wide range of outdoor activities, including cycling, surfing, skiing, and backpacking – especially when shared with his family, friends, and his dog, Agnew. He is also deeply committed to youth sports and has been actively involved in coaching and organizing athletic programs since the early 1980s.
Dan Campbell, CFA®
Senior Strategic Investment Advisor
Dan is a Senior Strategic Investment Advisor bringing over a decade of investment management research and experience. He works closely with individuals and families to help them navigate the complexities of their financial lives through a comprehensive approach. Prior to joining Beacon Pointe through the acquisition of Waypoint Wealth Partners in 2025, Dan spent ten years at a national Registered Investment Advisor (RIA) firm, where he advised both individual clients and fellow financial advisors. His ability to simplify complex investment concepts into clear, actionable guidance reflects his dedication to delivering clarity and confidence to the clients he serves. Dan holds a Master of Science in Finance from Washington University in St. Louis, a Bachelor of Science in Economics from Truman State University, and is a CFA® Charterholder. Outside of the office, Dan enjoys spending time with his wife and three children in Colorado Springs. An outdoor enthusiast, he can often be found mountain biking, trail running, hiking, or camping, as well as cheering on his kids in their many activities.

Jill Rea
Associate Wealth Advisor
Jill is an Associate Wealth Advisor for the Beacon Pointe Mill Valley, CA office. With over 25 years of experience in business operations and finance, she works closely with clients to provide tailored wealth management solutions, integrating investment strategy, financial planning, and long-term wealth stewardship. Prior to joining Beacon Pointe through the 2025 acquisition of Waypoint Wealth Partners, Jill led operations at high-growth companies in the technology and e-commerce sectors, where she specialized in scaling and streamlining business systems. Her career also includes entrepreneurial ventures, such as founding a group travel coordination platform and a blockchain-based solution for private investments. Jill began her career in finance in 2000, holding roles in asset management and at Schwab Advisor Services, where she supported independent Registered Investment Advisors (RIAs) in growing their businesses. Jill earned her Bachelor of Arts in Music Performance (viola) from the University of California, Los Angeles, holds a Master of Business Administration from the Haas School of Business at the University of California, Berkeley, with a dual focus in finance and entrepreneurship, and is a member of the Women’s Advisory Institute at Beacon Pointe and the Financial Planning Association. Outside of the office, Jill serves as the founding board president of Refugia Marin, a Marin-based nonprofit dedicated to transforming public spaces into native plant habitats for pollinators and promoting environmental education. She enjoys hiking the trails of Marin with her dog, Remy, baking sourdough, and exploring the world on travel adventures with her husband and two boys.

Rachel Sowers, CFP®
Senior Associate Wealth Advisor
Rachel is a Senior Associate Wealth Advisor for the Beacon Pointe Mill Valley, CA office. She has nearly a decade of experience in the financial services industry and is passionate about helping clients gain clarity and confidence in their financial lives. Rachel enjoys supporting a wide array of clients with different financial situations and is especially drawn to working with healthcare professionals, an interest inspired by her husband’s career in medicine. She understands the unique challenges and time constraints faced by those in the field of medicine and is committed to helping them navigate their financial journeys with ease and efficiency. Rachel holds a B.S. in Biological Sciences and an MBA from Virginia Tech. She is also a CERTIFIED FINANCIAL PLANNER® (CFP®) professional and a member of the Beacon Pointe Women’s Advisory Institute. She, her husband, and their dog, “Otter,” live in Glen Ellen, CA where they enjoy hiking, visiting local wineries, and spending time outdoors and with family and friends. A lifelong equestrian, she has been riding competitively since the age of seven and continues to find joy in every trip to the barn.
Rania Ghawi, CFP®
Wealth Advisor
Rania is a Wealth Advisor for the Beacon Pointe Mill Valley, CA office, bringing over a decade of experience in the financial services industry and a passion for guiding clients through a personalized and comprehensive planning process. Prior to joining the financial planning field, Rania worked at the U.S. Attorney’s Office, where she supported attorneys in the prosecution of criminal cases. Her diverse background enhances her ability to connect with clients and support them in seeing the broader picture of their financial lives. Rania earned her B.S. in Finance and Marketing from California State University, Sacramento, is a CERTIFIED FINANCIAL PLANNER® (CFP®) professional, and a member of Beacon Pointe’s Women’s Advisory Institute. Outside of the office, Rania enjoys yoga, cooking, and spending time with family and friends. She is always looking to plan her next adventure, many of which are inspired by previous travels.
Client Service & Operations

Avelina Amescua
Operations Manager
Avelina is an Operations Manager for the Beacon Pointe Mill Valley, CA office and is dedicated to streamlining and optimizing operational workflows. Avelina plays a key role in both day-to-day operational management and large-scale project execution, contributing to the firm’s overall efficiency and client experience. Prior to joining Beacon Pointe through the acquisition of Waypoint Wealth Partners in 2025, Avelina supported the Waypoint team in a similar capacity. She holds a bachelor’s degree in International Business from San Francisco State University and has a background in the hospitality industry, where she developed her client service acumen and proactive mindset. Avelina is also an active member of the Beacon Pointe Women’s Advisory Institute. Outside of the office, Avelina enjoys spending time in nature and exploring new destinations. She also appreciates relaxing with her dog Chunk, catching up with friends, and practicing hot yoga.
Lindsay Wulf
Senior Relationship Manager
Lindsay is a Senior Relationship Manager for the Beacon Pointe Mill Valley, CA office. With more than two decades of experience in the financial services industry, Lindsay supports clients and advisory teams through a comprehensive, relationship-centered approach, playing a key role in enhancing operational efficiencies, onboarding new client relationships, and maintaining a high standard of service excellence. Prior to joining Beacon Pointe through the 2025 acquisition of Waypoint Wealth Partners, Lindsay held a variety of roles in client service, training, and human resources at another wealth management firm. Her diverse background enables her to bring a thoughtful, people-first perspective to her work with clients and colleagues alike. Lindsay holds a B.S. in Psychology with a minor in Mathematics from Eckerd College in St. Petersburg, FL, and is SHRM-CP certified. She is also an active member of the Beacon Pointe Women’s Advisory Institute. Outside of the office, Lindsay is an active volunteer with Big Brothers Big Sisters and is on the PSO board for her children’s high school. She also enjoys running, hiking, cooking, and reading in her free time.
River Galland
Client Service Associate
River is a Client Service Associate for the Beacon Pointe Mill Valley, CA office, where he supports clients through a personalized and relationship-driven approach to financial planning. River began his career while earning his Bachelor of Science in Financial Management from Cal Poly San Luis Obispo, gaining early exposure to the financial advisory space through positions at a local broker-dealer and Registered Investment Advisory (RIA) firm. He further deepened his passion for financial planning during his internship at Yeske Buie, where he experienced firsthand the impact of building meaningful client relationships and delivering customized advice. One of his proudest achievements was helping Cal Poly become affiliated with the CFP® Board, paving the way for future students to pursue the CERTIFIED FINANCIAL PLANNER® (CFP®) designation through the university. Born and raised in Mill Valley, California, River’s love for golf, surfing, and the outdoors continues to shape his active lifestyle.
Financial Advisory Services Tailored to Your Needs
Our process and attention to detail ensure your wealth plan allows you to make smart choices about your financial future through informed decisions.
Financial Planning
Our holistic allWEALTH® approach addresses all aspects of your financial well-being.
Retirement Planning
We help clients achieve their best retirement by making smart, informed choices now.
Estate Planning
We’ll help ensure you have the necessary documents in place to protect your family and legacy.
Strategic Tax Planning
Our team is well-versed at integrating tax strategies across your portfolio and financial plan.
Investment Management
We offer customized investment solutions with diverse strategies on an open platform.
Healthcare Planning
Our team can guide you in confidently planning for your future healthcare needs.
Asset Protection
Our team uses their expertise to design a protection plan for your family and assets.
Family Office Services
Our role is to help ensure that your wealth will last you and your family for generations to come.